
Shaker Fundamental Growth - 2Q 23 Update
Domestic equity returns were strong in the second quarter and year to date, especially for the largest market capitalization stocks. The seven largest companies, comprising 28.2% of the total market cap of the S&P 500 as of June 30th, accounted for 75.8% of the total appreciation in the S&P 500 for the first six months of the year. The remaining 493 stocks in the Index accounted for the other 24.2%. Furthermore, the ten largest NASDAQ companies in terms of total gain in market appreciation for that period accounted for over 81% of the S&P 500 appreciation. Rarely have stock market returns been this dominated by the largest companies. Apple, Inc. (AAPL) is the largest company by market capitalization at over three trillion dollars. Following a gain of 49.3% for the year through June 30th, Apple is now worth more than the combined value of all the stocks in the Small Cap Index (the smallest 2,000 market capitalization companies of the 3,000 largest). If an investor did not overweight these 7-10 stocks in their investment portfolios, it was difficult to outperform the market.
Year to date, we have been underweight Apple (AAPL), NVIDIA (NVDA), Tesla (TSLA), and Meta (META) and it hurt our returns. Going into the year, given slowing growth and elevated recession risks, we did not expect the market to show the type of strength it has, especially for these large technology stocks. We believed the market would need greater clarity on the outlook for growth in the economy before it would make a strong run higher. However, the decline in the rate of inflation, the absence of a recession to date, excitement around the potential of artificial intelligence (AI), strength in travel and employment, and a turnaround in new home orders have been more than sufficient to drive markets higher.
The year-to-date move in stocks has largely been driven by sentiment, as company performance and the broader economy exceeded widespread bearish expectations entering the year. Following an approximately 5% decline in expected S&P 500 earnings per share over the next twelve months (forward EPS) in the second half of 2022, growth in forward EPS for the index stabilized in the first half of 2023, rising 1.7%. With company earnings relatively flat, improved sentiment, evidenced by an increase in the forward price-to-earnings (P/E) valuation multiple from 17x to 20x, was the main driver for the rise in the S&P 500 this year. While we anticipated the relatively weak outlook for company fundamentals, we were surprised by the improvement in sentiment that has driven large-cap valuation multiples to levels only exceeded during bubbles of the dot-com era (1998-2001) and post-COVID (2020-2021). We are open to the possibility that earnings growth will reaccelerate to justify temporarily elevated valuations. Given the current set-up, however, we believe investors will be better served to focus on areas of the market outside of the largest stocks.
One factor that has been influencing our performance has been the underperformance of smaller capitalization stocks this year, as well as in the last twelve years. We have always had a larger portion of our investments in small-cap companies than their actual share of the market’s total capitalization. This has allowed us to profit from our strong research capabilities and to take advantage of expected market inefficiencies around small-cap stocks. For the last twelve years, smaller capitalization stocks have underperformed large caps primarily driven by changes in valuation multiples. The forward P/E for the S&P 500 rose from 11x in 2011 to 20x today, while small- (S&P 600 Index) and mid-cap (S&P 400 Index) stocks are valued at 14x earnings, similar to the forward P/E they were valued at twelve years ago. Small- and mid-cap P/E ratios are at extreme discounts to larger capitalization P/E ratios (see Chart 1). We expect this trend to reverse, as happened at other times when the valuation difference reaches such extremes, and for smaller capitalization companies to outperform again at some point in the future. Importantly, the last 45 days have seen a broader advance in stock prices, beyond the large tech names. This is encouraging, but it is very difficult to predict the exact timing of an expected longer-term trend change.
Chart 1: Forward P/E Ratios for S&P 500, S&P 400, and S&P 600, Source
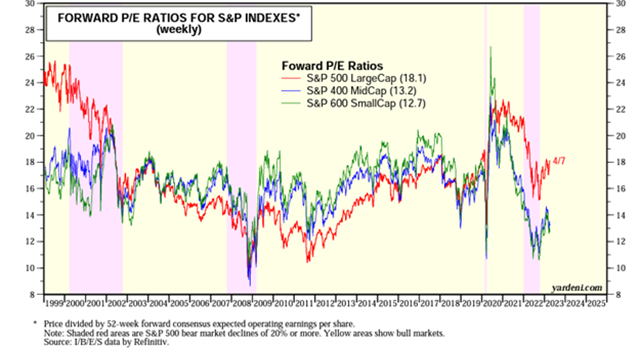
Source: Yardeni Research
Discussion of Second Quarter Performance and Positions
The largest positive contributors to returns during the quarter were Broadcom (AVGO), CoStar Group (CSGP), The Trade Desk (TTD), D.R. Horton (DHI), and Amerisource Bergen (ABC). Our largest detractors during Q2 were Concentrix (CNXC), Insulet (PODD), PagerDuty (PD), Cavco (CVCO), and Paylocity (PCTY).
Investment Outlook
The investment outlook has changed dramatically in the last twelve months. One year ago, the stock market experienced one of the worst first halves ever. Many economists and stock market strategists were certain that the Fed interest rate hikes would drive the economy into a recession. A year has passed, and we have not had a recession. More economists are starting to believe that we may get a soft landing. We are not going to make an economic forecast, but rather focus our efforts on identifying differentiated businesses at attractive valuations that can outperform their peers regardless of what happens in the broader economy. However, we do note a few observations on the current economic backdrop:
Rate hikes are having less of an impact on consumers because most homeowners refinanced their mortgages when rates were extremely low. According to Fortune, over 70% of borrowers have mortgage rates locked in below 4%. This is making it much easier for homeowners to keep on spending.
Housing prices are not collapsing. Homeowners with low mortgage rates locked in are unwilling to sell and trade up. There is so little inventory for sale that existing home prices have increased in the face of much higher mortgage rates.
The economy appears to have experienced a series of rolling sector recessions, but not a general economic recession. In 2020 and 2021, COVID limited travel. Travel is now booming. New auto sales were constrained by production shortages. New car sales are now growing as the auto manufactures are producing sufficient vehicles. During the COVID shutdown, many people purchased the available consumer items like furniture and electronics, and reduced expenditures on services (e.g., restaurant meals). Consumers are now spending on services and have reduced purchases of some goods.
We see similar things when we look at companies. Some are booming and some are suffering. Airlines, hotels, and cruise companies are all having much better years because people want to travel to make up for the travel that was avoided during COVID. Manufacturing indices have been signaling a declining economy for months, but heavy-equipment manufacturer Deere (DE) reported revenues were up 33% in the most recent quarter. US homebuilders had a large drop in orders last year as interest rates increased, but orders have been improving thus far in 2023. Lastly, the government infrastructure spending bill is creating a boom for companies like Wesco (WCC) and Quanta Services (PWR).
The economic picture is mixed, yet we are finding growing companies that can be purchased at attractive prices due to the significant stock market correction of the last two years. Earlier in the letter we cited the impact that a few large companies had on market returns for the first 6 months of the year. Valuations for these companies now significantly exceed those of most of the remaining stocks. The ten largest companies comprise 31.5% of the total market cap of all companies in the S&P 500 and have a forward P/E ratio of 31x. Average forward P/E ratios for the remainder of the large cap index (segmented by size) are between 18x and 14x (see Chart 2). Profitable small- and mid-cap companies carry P/E ratios that are in general even more discounted compared to the largest companies. Whether or not we have a recession, we are confident that we will be able to find investments that outperform over the next 12 to 36 months.
Chart 2: Valuation by Market Cap Range & Weights
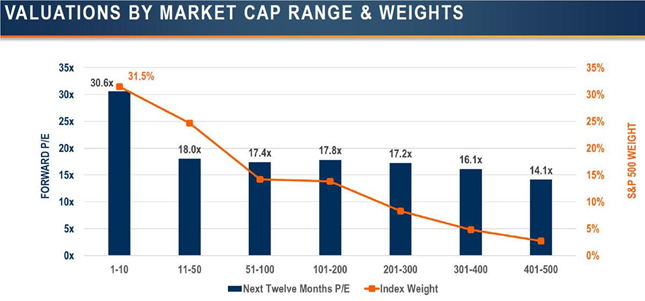
Source: First Trust and Capital IQ. Data as of 6/30/23. Estimates are based on the next four quarters’ earnings per share.
We hold a diversified portfolio of stocks in your account. Our largest holdings as of August 1, 2023, are as follows:
The Trade Desk (TTD) - Consumer Discretionary
Axos Financial (AX) - Financial Services
CoStar Group (CSGP) - Real Estate
Paylocity (PCTY) - Industrials
WESCO International (WCC) - Industrials
Dexcom (DXCM) - Healthcare
Insulet (PODD) - Healthcare
Alphabet (GOOGL) - Technology
Broadcom (AVGO) - Technology
Micron Technology (MU) - Technology
The ten largest positions listed above are 30.3%, which remains a lower concentration than we typically have for the top-ten holdings. In terms of sector exposure, we are slightly overweight Industrials, Consumer Staples, and Consumer Discretionary relative to the broader market index, roughly in-line Telecom, Health Care, Real Estate, Energy, Materials, and Utilities, and our most underweight sectors are Technology and Financials.
We look forward to updating you in October and we are always available to assist in any way we can.
Sincerely,
The Shaker Investment Team