
Is it Time for Investors to Buy Small Caps?

Brandon Hemmelgarn
Co-Chief Investment Officer
After a robust start to the year for most stock market participants, with the S&P 500 increasing 7.5% in the first quarter, many investors may be questioning their allocations to small cap stocks which rose just 2.7% in the quarter. For investors in this segment of the market, the frustrating trend is not just a 2023 phenomenon, as small cap stocks also lagged in 2022 and 2021.
In fact, over the last five years through 12/31/2022, small cap stocks have lagged by over 5% per year, with an annual return of 4.1% relative to 9.4% per year for the S&P 500. With recent news headlines highlighting bank failures and elevated recession risks, it can be hard to envision the trend changing anytime soon as larger companies tend to offer lower volatility and more stable business models compared to their smaller peers.
However, for those looking beyond the uncertainty of the next few months of 2023, we may be approaching a historically rare opportunity for small cap stocks to generate meaningful outperformance for investors with longer time horizons over the next 3-5 years. Given the difficulty to perfectly time any investment, we think it makes sense for investors to begin increasing their allocations to small cap stocks, and plan to periodically do so over the next 6-12 months to position themselves ahead of several multi-year tailwinds:
The cyclical nature of the relative performance for small vs. large stocks
Small caps historically outperform following bear market drawdowns in stocks
Attractive valuations for small caps relative to large caps
Slowing inflation is a tailwind for stocks broadly, and particularly small caps
Let’s dig into each of these with a few charts.
The cyclical nature of the relative performance for small vs. large stocks
Historically, the stock market has gone through multi-year cycles in terms of the relative outperformance of small caps or large caps (albeit with shorter-term performance cycles month-to-month), as shown in Chart 1.

Chart 1: Relative Performance of Small Cap Index vs. S&P 500 (1988 – Present), Source: Intrinsic Research
Over longer time periods, the performance of both small caps and large caps tends to converge at an annual return rate of ~10% (matching the long-term annual growth in earnings plus capital returned to shareholders). Extreme outperformance of either large caps or small caps tends to reverse over time due to the general efficiency of markets, and consistent outperformance will be arbitraged away and disappear. Academic research has historically made an even stronger case for small caps, suggesting that small cap stocks tend to outperform over time due to the riskier nature of such stocks, and investors are compensated with higher returns for the additional risk. While it is difficult to predict the exact timing of when the performance cycle will shift back in favor of small cap stocks, Chart 1 suggests that the recent large cap outperformance is approaching extreme levels and is less likely to continue.
Small caps historically outperform following bear market drawdowns in stocks
One other observation from Chart 1 is that small caps tend to outperform following recessionary bear markets—20%+ declines in stocks that coincide with an economic recession (shaded regions in the chart). In each of those periods over the last 35 years, small cap stocks outperformed large cap stocks as stocks broadly rebounded from their lows and the economy recovered. Conceptually, the outperformance makes sense as small caps tend to be more volatile and sensitive to the economic cycle.
Many economists and forecasters anticipate a recession in 2023 or 2024, and the stock market has done a great deal to price in such a scenario for the economy with the S&P 500 down over 25% at the October 2022 low (~14% below all-time highs currently), and Small Caps down over 30% at the October 2022 low (~26% below all-time highs currently). While there may be some additional downside if a recession occurs, economic weakness and lower profits already seem to be reflected in the prices of small cap stocks so the incremental downside may be more limited than heading into other recessionary periods. In a “soft landing” scenario in which a formal recession is avoided, the stock market may have already hit the low point of the cycle, but we would anticipate a similar move higher for small cap stocks as earnings and economic data reaccelerates. In either a soft landing or a recession, history indicates that small caps will likely outperform large caps in the first few years of the new bull market.
Attractive valuations for small caps relative to large caps
Coinciding with the underperformance of small caps relative to large caps over the last five years, a large valuation multiple discount has developed for small cap stocks. Chart 2 shows the Price / 12-month Forward Expected Earnings (Forward P/E) ratios for large caps (S&P 500 index), mid caps (S&P 400), and small caps (S&P 600). Small and mid-cap stocks currently trade at ~13x Forward P/E, compared to a relatively more expensive 18x Forward P/E for large cap stocks. 13x Forward P/E for small and mid caps is comparable to the low double digit multiples those stocks troughed at during the 2008-2009 and 2020 bear markets, which were followed by new bull markets with historically strong stock returns and meaningful small cap outperformance in the subsequent years. Furthermore, the 5x P/E discount for small caps relative to large caps is a historic outlier, comparable to the tech bubble of the early 2000s, which was also followed by meaningful small cap outperformance as the valuation disconnect normalized. Even if a recession were to occur over the next twelve months, small caps may not see their typical underperformance from here as the potential downside seems to largely be already priced into valuation multiples, similar to the 2000-2002 period. If there is additional downside for small cap stocks, it positions them for further outperformance in the subsequent recovery rally coming out of the recession as relative valuations become even more attractive.
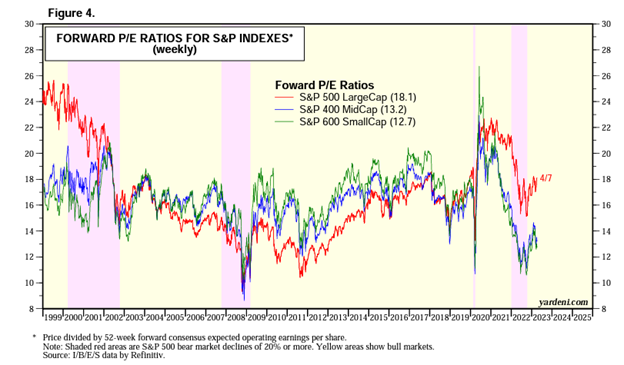
Chart 2: Forward P/E Ratios for S&P 500, S&P 400, and S&P 600, Source: Yardeni Research
Declining inflation is a tailwind for stocks broadly, and particularly small caps
Periods of declining rates of inflation have historically corresponded with strong returns for the stock market, as investors look forward to relatively more favorable Federal Reserve policy, lower interest rates, and tailwinds to consumer spending. Since 1926, the S&P 500 has, on average, returned 14.9% in years when inflation is slowing, outperforming the average 8.7% return in periods with rising inflation. The performance difference is even more meaningful for small cap stocks, which since 1980 (the beginning of data availability for the small cap index) have generated annual returns of 15.1% in years with decelerating inflation compared to 6.8% in years when inflation accelerated. (Source: Shaker Investments, Intrinsic, Bloomberg, and Slickcharts)
As Chart 3 shows, inflation peaked in June 2022 at over 9.0% YoY in the current cycle, and the disinflationary process has begun. The yearly change in the CPI most recently moved below 5.0% YoY in March 2023. It is widely expected to continue to move lower over the remainder of 2023 and in the following years, although there is much debate as to exactly how quickly the rate returns to a more normal range near the Federal Reserve’s target of 2.0%. As long as inflation continues to move lower and we do not see an unwelcome reacceleration before returning to the more normal range, history suggests that stocks, particularly small cap stocks, tend to do well in such an environment.
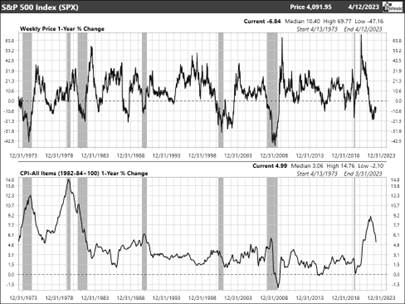
Chart 3: S&P 500 and Consumer Price Index (CPI) YoY % change, 1973 - Present, Source: Intrinsic Research
Conclusion
While there is no crystal ball when it comes to stock market performance, our experience at Shaker Investments guides us to recommend longer term investors take a close look at their small cap allocations as they position for the next 3-5 years. Small cap stocks offer a historically rare risk-reward set-up with valuations near historic lows at ~13x Forward P/Es, combined with the tailwind of declining inflation. Bear markets have historically been unpredictable in terms of their length and breadth, but with small cap stocks 26% below their prior peak and 18 months into the current bear market, we believe now is the time to start dollar cost averaging into small cap stocks to take advantage of the better times ahead when the new bull market begins (if it hasn’t already started).
Disclosure: Information herein has been obtained from public sources and we do not guarantee its accuracy. This document is not intended as investment advice or recommendation, nor is it an offer to sell or a solicitation of an offer to buy any interest in any fund or product. Past performance is not indicative of future results. An investment in any strategy is speculative and involves a high degree of risk, including potential loss of principal. There is no guarantee that an investment objective will be achieved, or that an investment strategy will be profitable. Investments in smaller companies may be riskier, less liquid, more volatile and more vulnerable to economic, market and industry changes than investments in larger, more established companies.